Customers

Trusted by the largest enterprises on the planet

Highlights

Monitor backlog and analyze your sprint velocity, lead time, build deployment trends, & more.
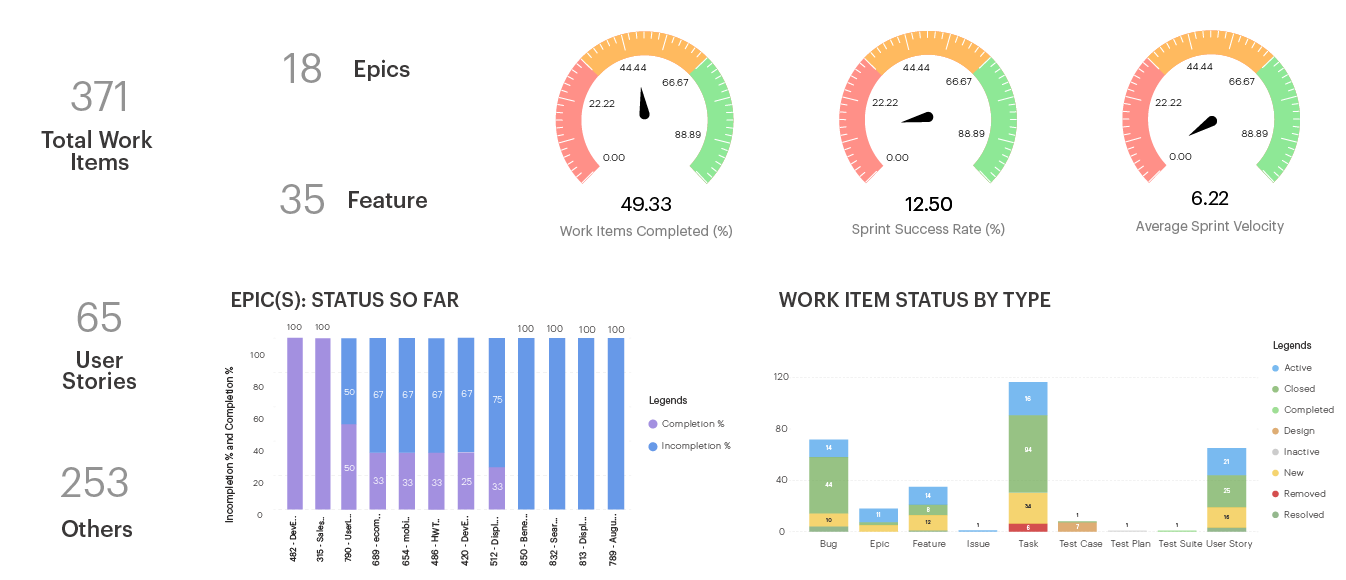
AgileMetrics

Track the four key DORA metrics - Deployment Frequency, Lead Time for Changes, Change Failure Rate, and Time to Restore Service.
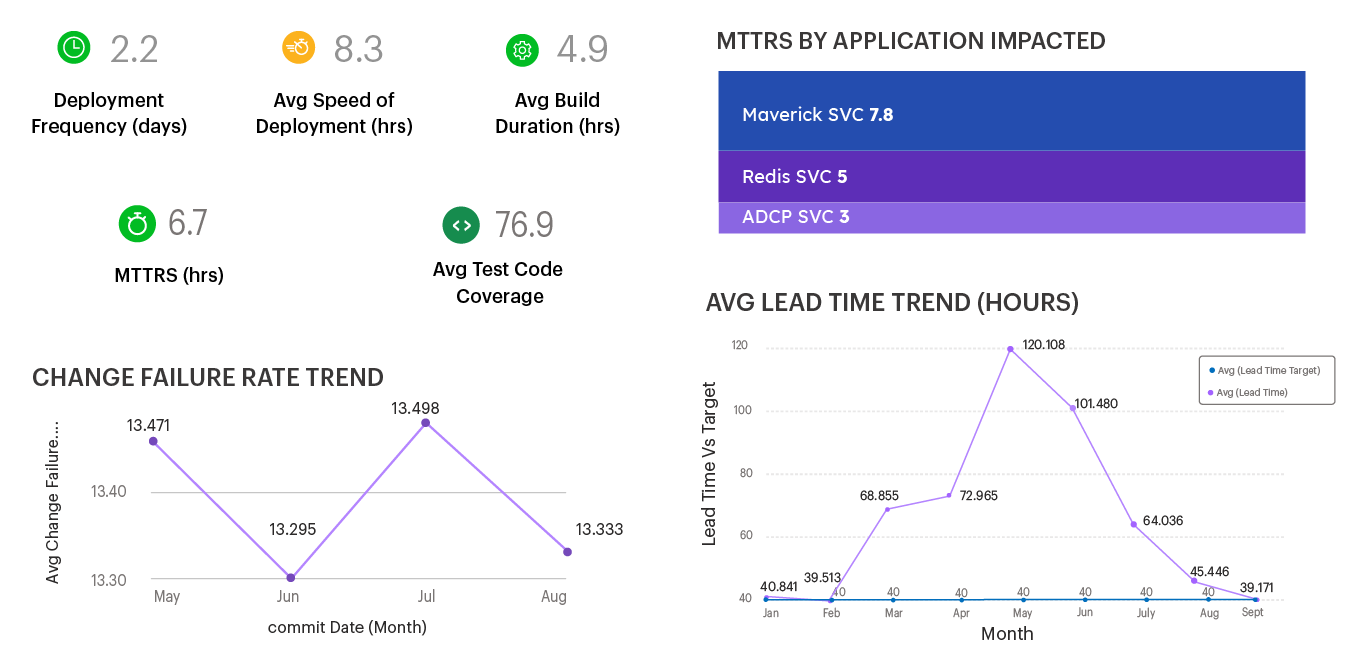
DORAMetrics

Stay on top of your infrastructure as code (IaC) pipelines to ensure optimal infrastructure provisioning.
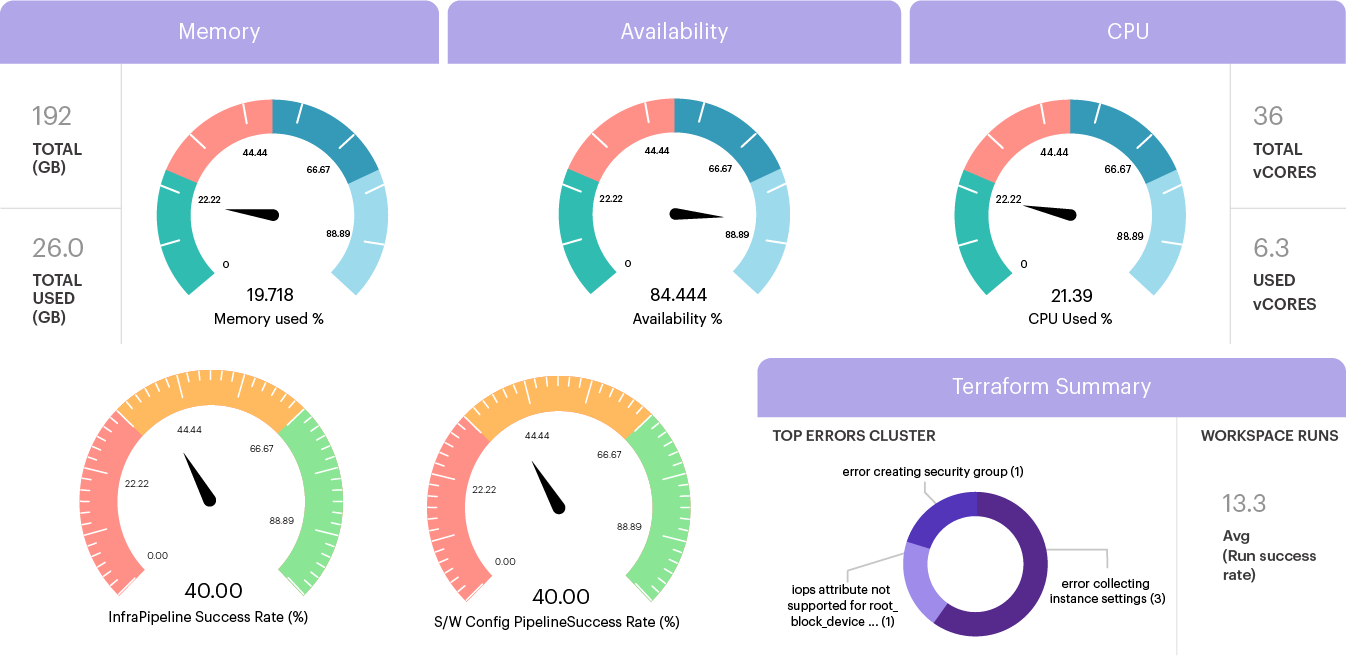
InfrastructureMetrics

Get increased traceability to drill down and across cloud cost, security, incidents, and more.
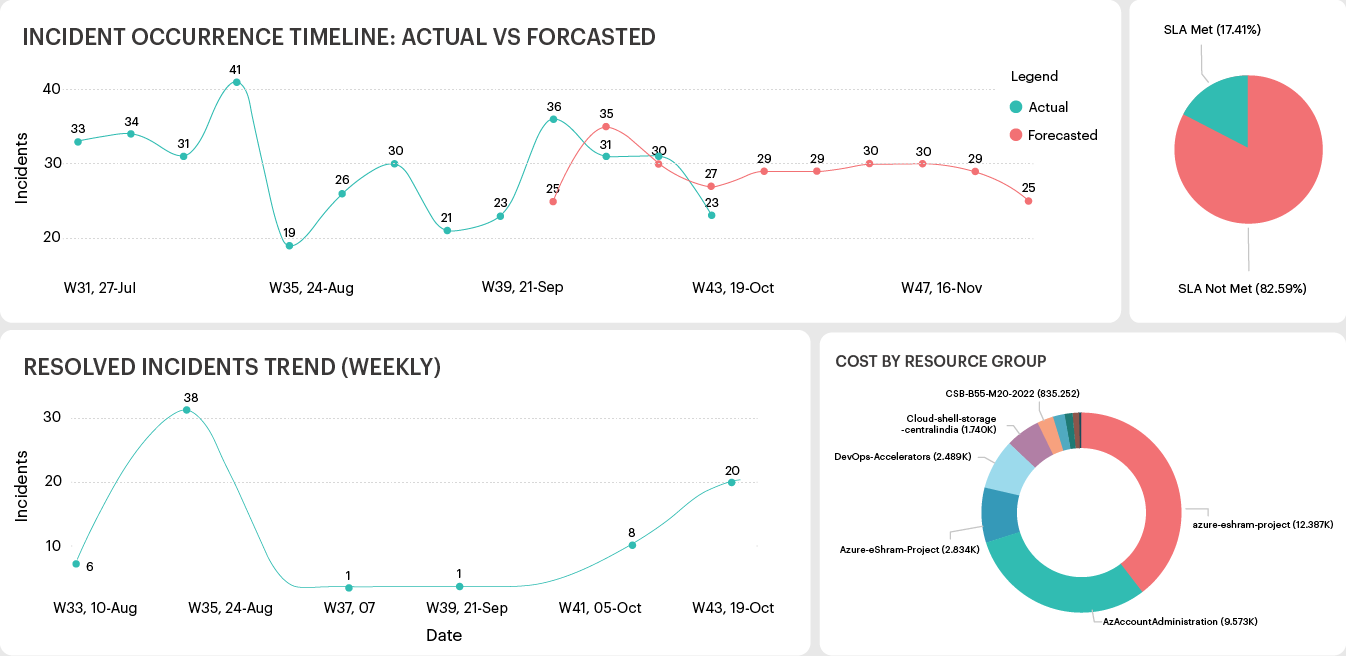
OperationsMetrics

Advantages

50x

More frequent code deployments

100x

Faster lead time between committing and deploying

3x

Lower change failure rate

400x

Faster recovery from incidents

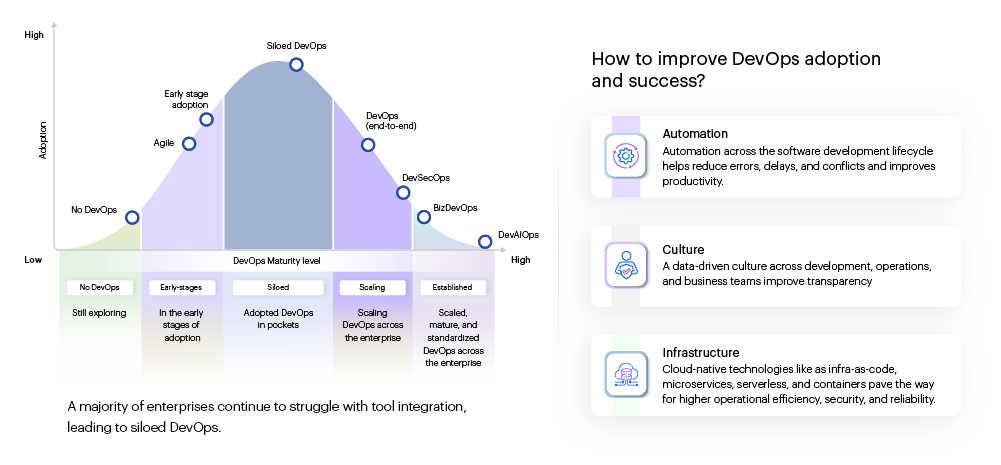
Where do you see yourself in the DevOps Adoption Curve?

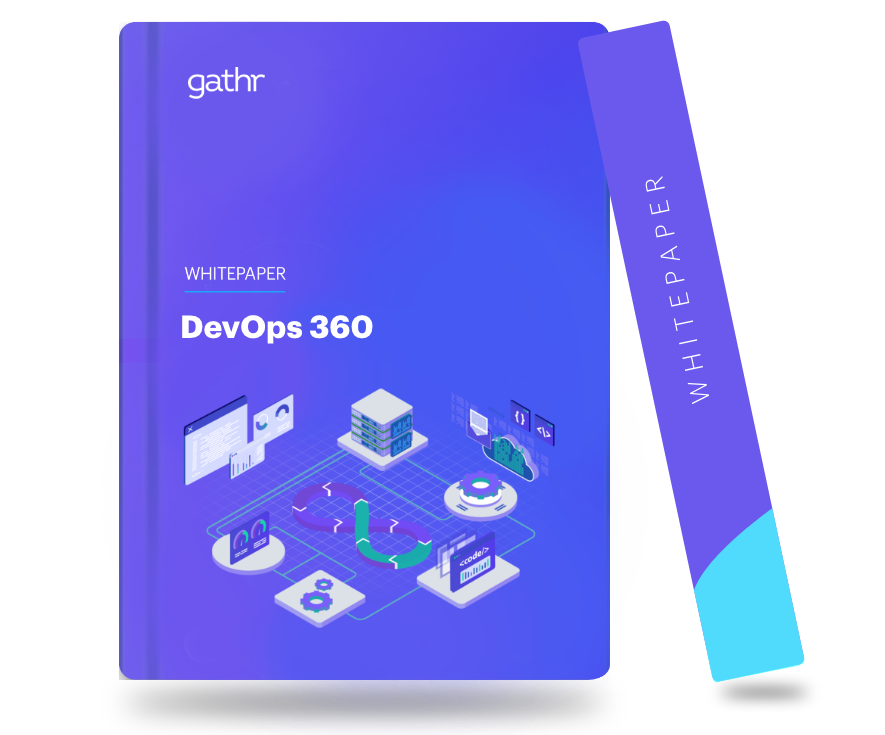
White Paper

DevOps 360

A Guide to Continuous DevOps Improvements

Download Now

Solution Details

Unified DevOps 360

Optimize hybrid and multi-cloud resources with unified DevOps 360

  • Too Many Dashboards

    Getting a unified view of applications, their underlying infrastructure, and networks is difficult.

  • Disjointed Toolchains

    Evolving toolchains with frequent updates, integration, and data sync requirements complicate data analytics.

  • Lack of Actionable Intelligence

    Monitoring health and performance and correlating application issues with infrastructure and network bottlenecks is challenging.

DevOpsMonitoringChallenges
  • Quick Integration

    Use out-of-the-box connectors to eliminate time and effort in complex API integrations.

  • Unified Insights & Actions

    Get pre-built apps and templates to monitor applications, infrastructure, cloud security, platform availability, and more.

  • Higher Predictability

    Use Python scripts and machine learning for predictive analytics, ensuring proactive response and timely, high-quality deliveries.

EnableContinuousMonitoring
  • Quantify Insights

    Monitor key Agile, DORA, Infra as Code (IaC), and Operations metrics to stay on top of your applications and environment.

  • Gain 360 Visibility

    Get detailed DevOps dashboards to monitor cloud/infra, application, platform, builds and deployments, incidents, & more.

  • Accelerate Troubleshooting

    Correlate application performance with infrastructure issues and bottlenecks to expedite root cause analysis and issue resolution.

ExperienceDevOps360

Integrations

Expert Opinion

Recognized by industry experts year after year

MEET GATHR

One-of-a-kind no-code, unified
data-to-outcome platform

  • No-code for data at scale, batch and streaming
  • Gen AI help to search, understand, query, and build easily
  • 250+ connectors,
    200+ operators,
    50+ apps and
    solution blueprints
  • Unified collaborative experience
  • Best of open source and enterprise grade
  • Production ready output from day 1

Capabilities

Learning and Insights

Stay ahead of the curve

FAQS

Find Your Answers

What is continuous monitoring in DevOps?
Continuous monitoring is a monitoring approach that focuses on increased automation and integration of tools to unify data, metrics, and insights around application performance, security threats and vulnerabilities, compliance risks, user experience, and more. It essentially integrates application, infrastructure, and network monitoring. Continuous monitoring can help DevOps teams detect and resolve application issues quickly, avoid unplanned outages, and meet their performance targets as well as business goals effectively.
How to enable continuous monitoring in DevOps?

Continuous monitoring in theory involves monitoring the health, performance, and reliability of both your application and infrastructure components across development and production. As every cloud service provider offers its own monitoring solution, DevOps teams often have to track different dashboards to ensure continuous monitoring. Controlling virtual sprawl and costs, and ensuring every application component is compliant, secure, and available becomes challenging due to the lack of unified monitoring. That’s why it is recommended to gather all your data from the application and its underlying network and infrastructure in one place for continuous monitoring in DevOps. This data can include:

  • Throughput
  • Browser speed
  • SLA status
  • CPU, Storage, & Disk Usage
  • Server Availability/ Uptime Trends
  • Mean Time to Restore (MTTR) & other response times
  • Latency
  • Diagnostics logs & insights
  • Container insights, and more

It is important to note here that data from a single source can only tell so much; it is important to correlate data from different sources to troubleshoot issues or find opportunities for continuous improvement. In this respect, teams need to visualize their data, should have the ability to easily slice and dice the data, define their own formulas and thresholds for alerts, establish quality gates, and derive contextual insights from plain text data. Gathr makes all this simple with its DevOps 360 solution.

What are the primary benefits of continuous monitoring?

Here are some of the benefits of continuous monitoring in DevOps:

Enhanced Operations: With automated data collection and streamlined end-to-end visibility, teams can collaborate better to detect and mitigate security and performance issues.

Proactive Response: With unified visibility, teams can configure more accurate threshold and event-based alerts to respond quickly and troubleshoot issues before they snowball into a major outage.

Cost Savings: Teams can analyze resource consumption data over a period to detect cyclic trends and over-provisioning/under-provisioning issues. It can allow organizations to ensure the most efficient usage of resources (CPU, RAM, etc.).

Better End User Experience: With timely, hiccup-free deliveries and quicker resolution of performance issues, users get a better application experience.

How to set up a DevOps monitoring dashboard?
Today, teams rely on different dashboards to monitor their applications and the underlying infrastructure. Hybrid or multi-cloud environments add to the complexity. Teams need to set up various dashboards using Elastic Search, Logstash, Grafana, Nagios, Prometheus, CloudWatch, etc. to monitor different aspects of applications and the environment. However, it’s not always simple to gather data and configure dashboards that provide actionable intelligence. Hence, it’s important to define monitoring goals, select the right KPIs, and shortlist a scalable and flexible monitoring solution that can simplify search, filtering, visualization, and analytics. You can classify data and insights into different segments such as server status and health, security and vulnerability trends, resource consumption and costs, development milestones, user experience, and more.
How to automate DevOps KPI capturing and analysis?
To automate data capturing and synchronization across your DevOps environment, you need to ensure that all tasks and tools across your environment are well integrated and orchestrated. These integrations can get complex, posing several restrictions, and requiring frequent updates. Gathr takes care of all such integration complexities with its bi-directional connectors that pave the way for automated insights delivery. bi-directional connectors