Customers

Trusted by the largest enterprises on the planet

Highlights

The average time code changes take from their first commit to when they reach production

MeanLeadTimeForChanges

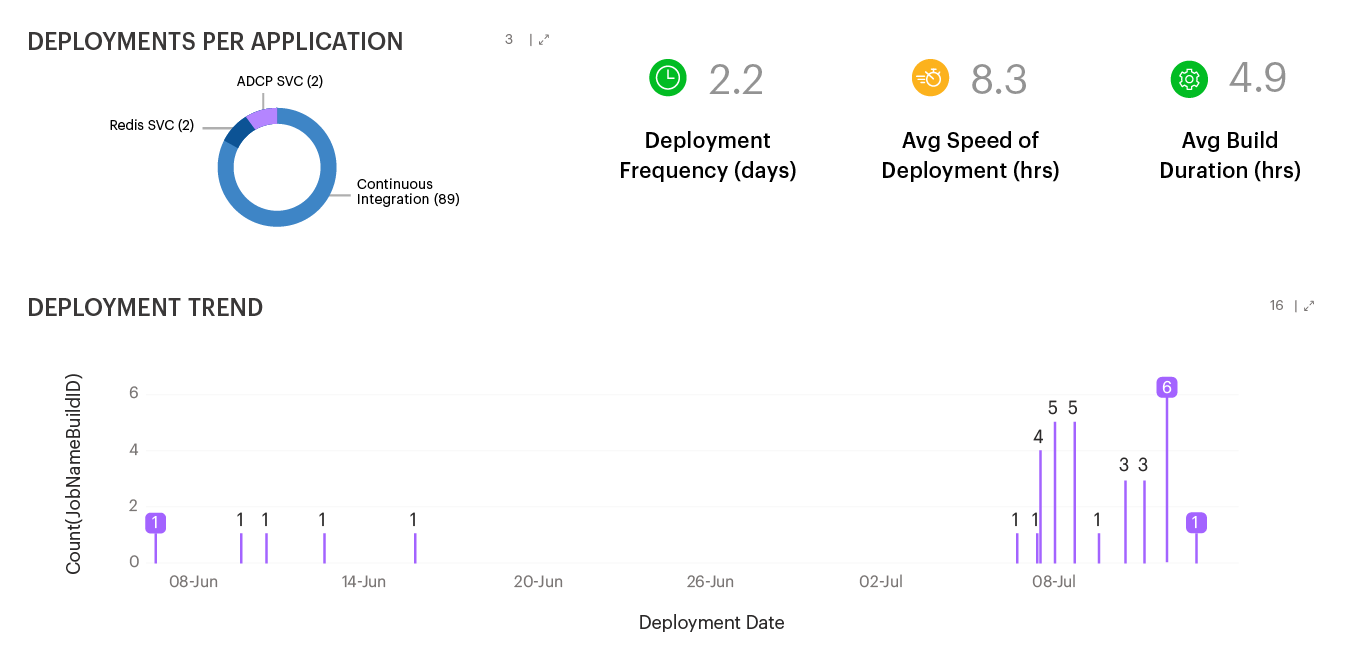
The number of times code is deployed to production over a period (day, week, month)

DeploymentFrequency

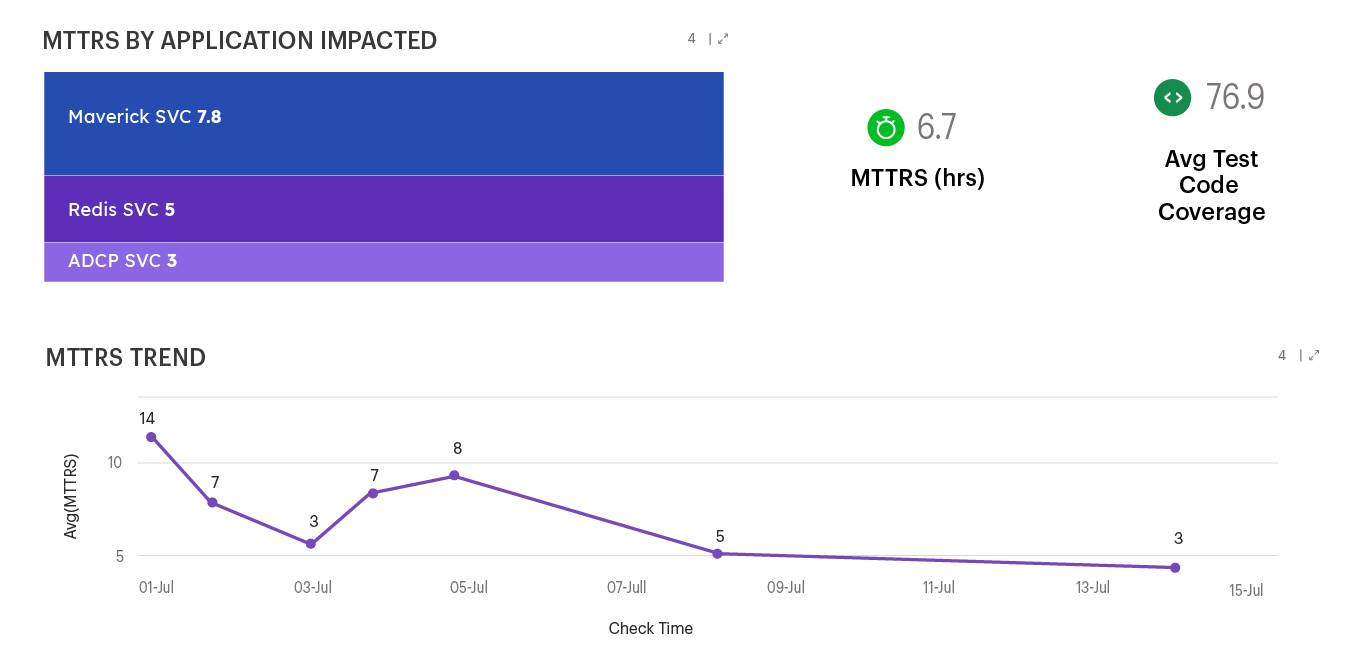
The average time a team takes to restore service or resolve a bug from the time it’s logged into the system

MeanTimeToRestoreService

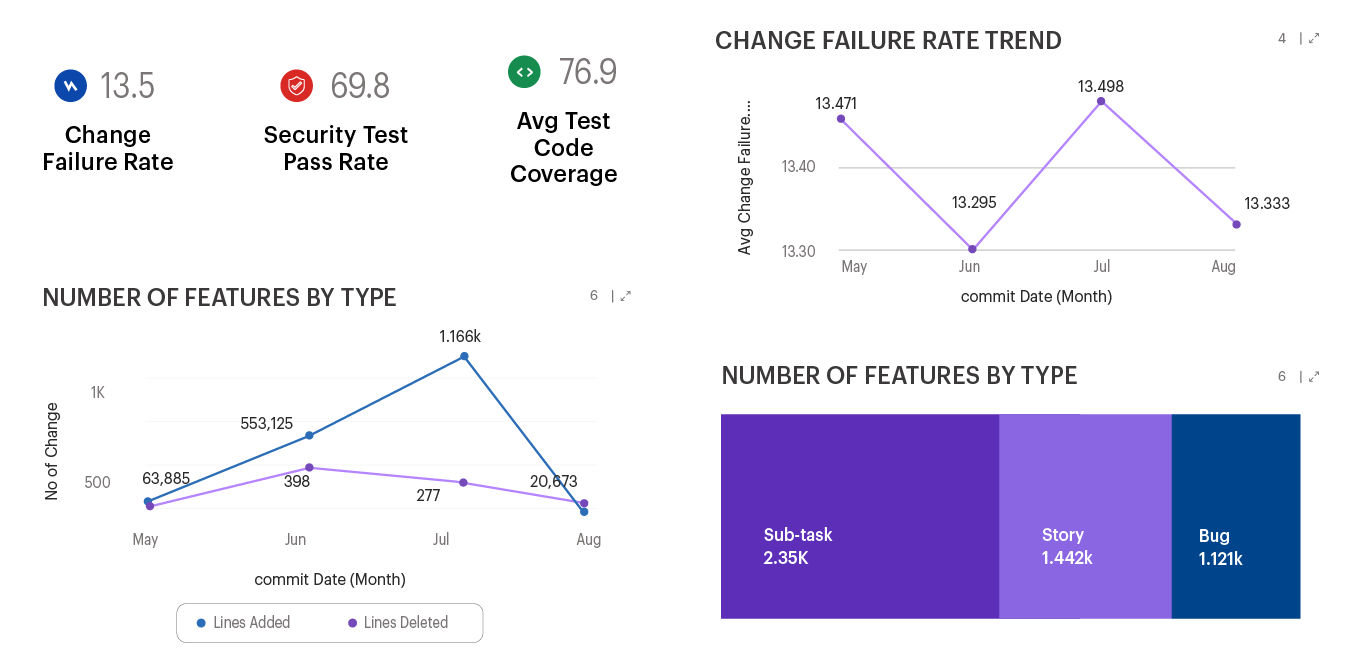
The percentage of code changes leading to a failure in production and requiring remediation steps such as hotfixes and rollbacks

ChangeFailureRate

Recently, DORA has introduced a new metric for measuring operational performance as Reliability. It is an aggregated metric based on availability, latency, performance, and scalability parameters.

Advantages

50x

More frequent code deployments

100x

Faster lead time between committing & deploying

3x

Lower change failure rate

400x

Faster recovery from incidents

Gathr Optics

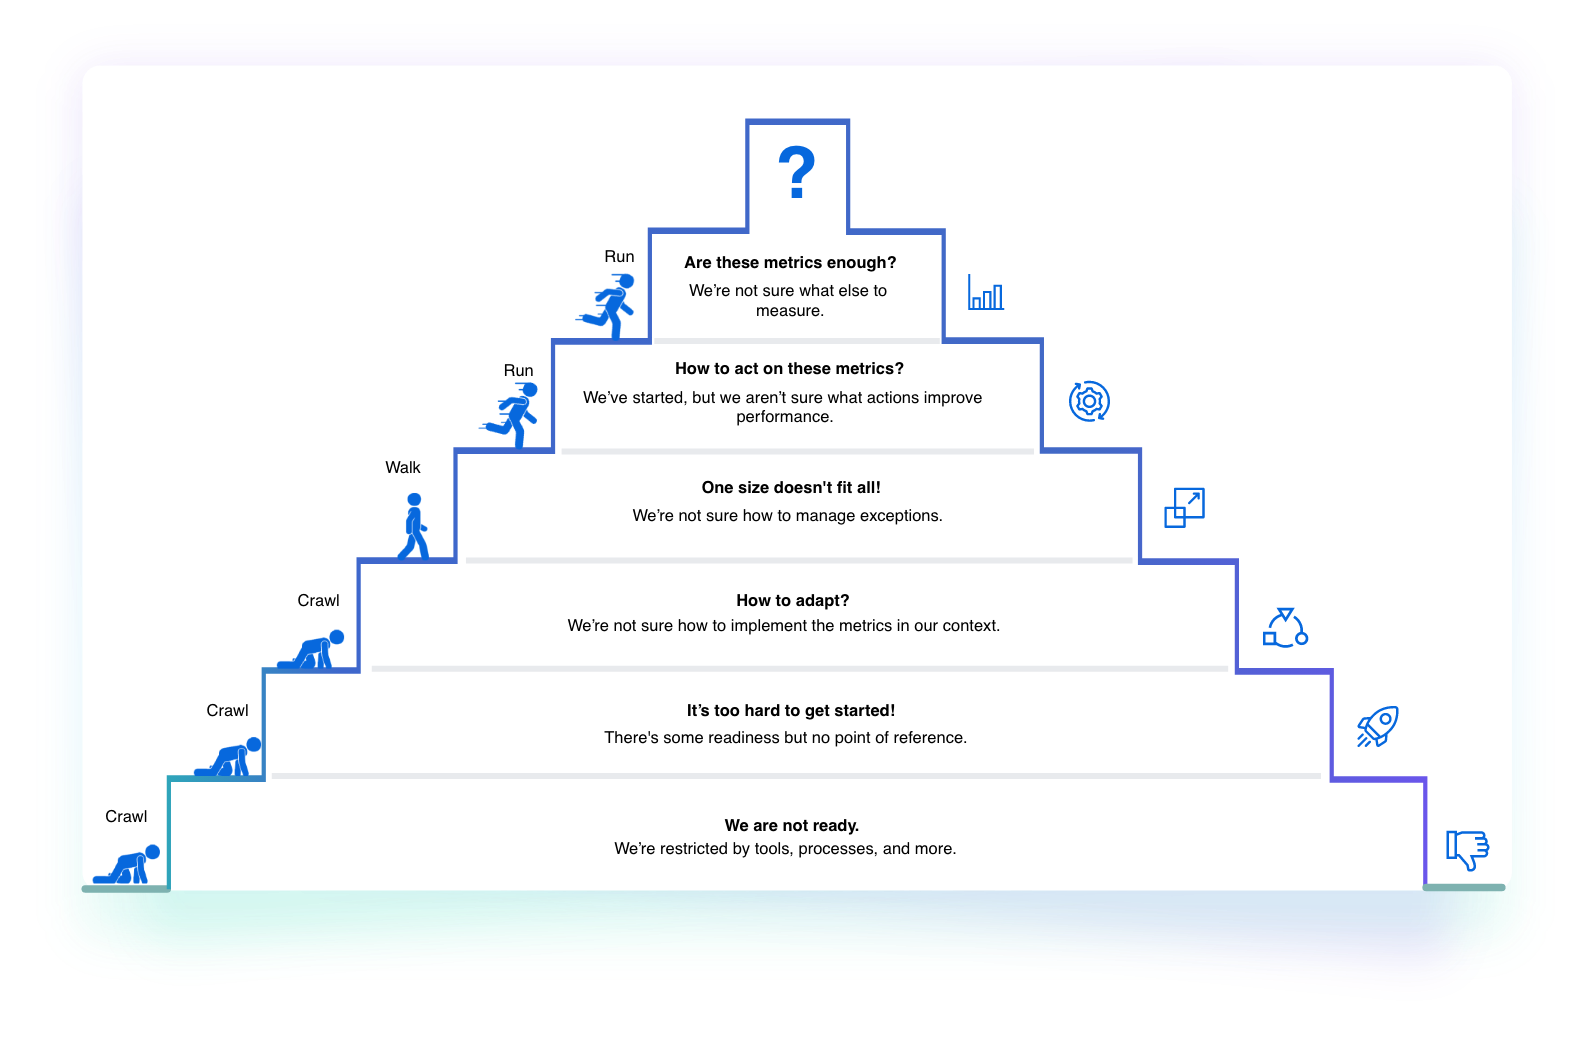
Where do you see yourself in terms of DORA metrics implementation?

When asked about their DORA metrics implementation & success, here’s how most organizations respond.

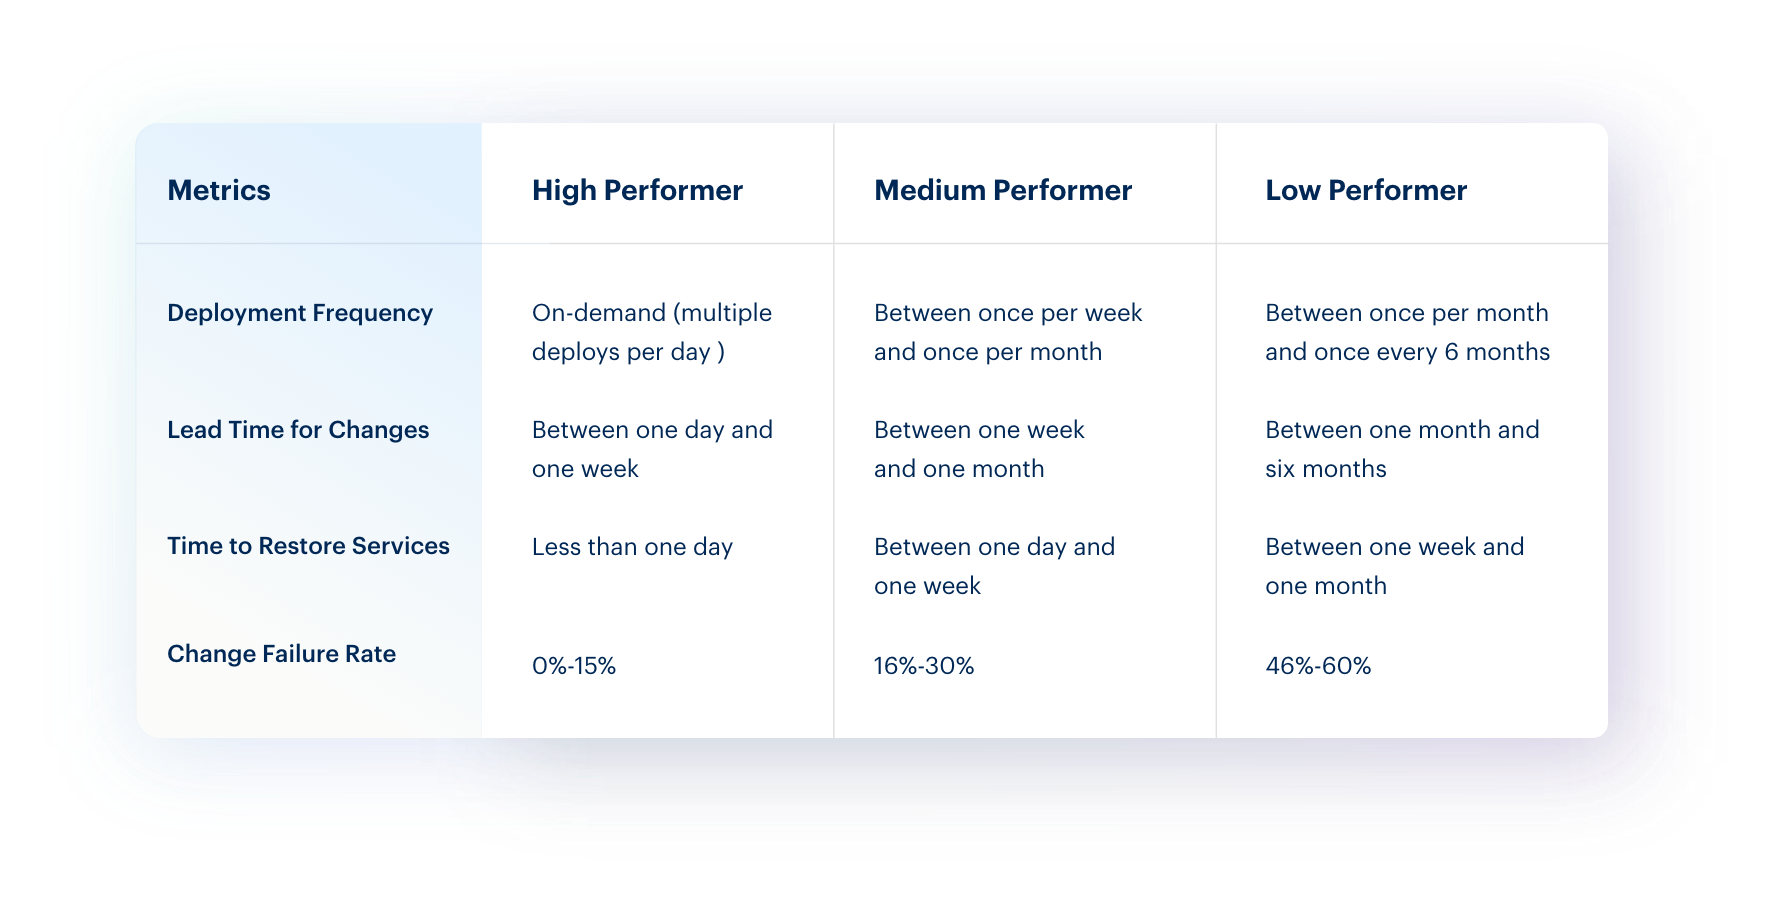
How do you compare yourself to industry peers?

For your reference, here’s how DORA categorized organizations as high*, medium, and low performers in its Accelerate, State of DevOps 2022 report.

Transition from ‘crawl’ to ‘run’ and the next steps to become a high performer with Gathr

Irrespective of whether you are getting started with DORA metrics or unsure about the next steps to be an elite performer,Gathr can help you make the most of DORA metrics.

White Paper

DORA Metrics and Beyond

Continuously Monitor and Optimize DevOps Performance

Download Now

Solution Details

Deep Dive Into DORA Metrics

Boost your DevOps health and performance with timely optimization.

  • Ineffective Analysis

    Cross-tool data correlation, trend-analysis and delivery flow assessment is difficult.

  • Lack of Automation

    Manual data collection from multiple disparate tools for project management, SCM, CI/CD, ticketing, etc.

  • Lack of Flexibility

    Most tools do not allow to implement custom metrics, ormetrics or extend the scope beyond DORA.

DORAMetrics-MonitoringChallenge
  • Ready Integration

    Use out-of-the-box connectors to unify data across tools and calculate DORA DevOps metrics.

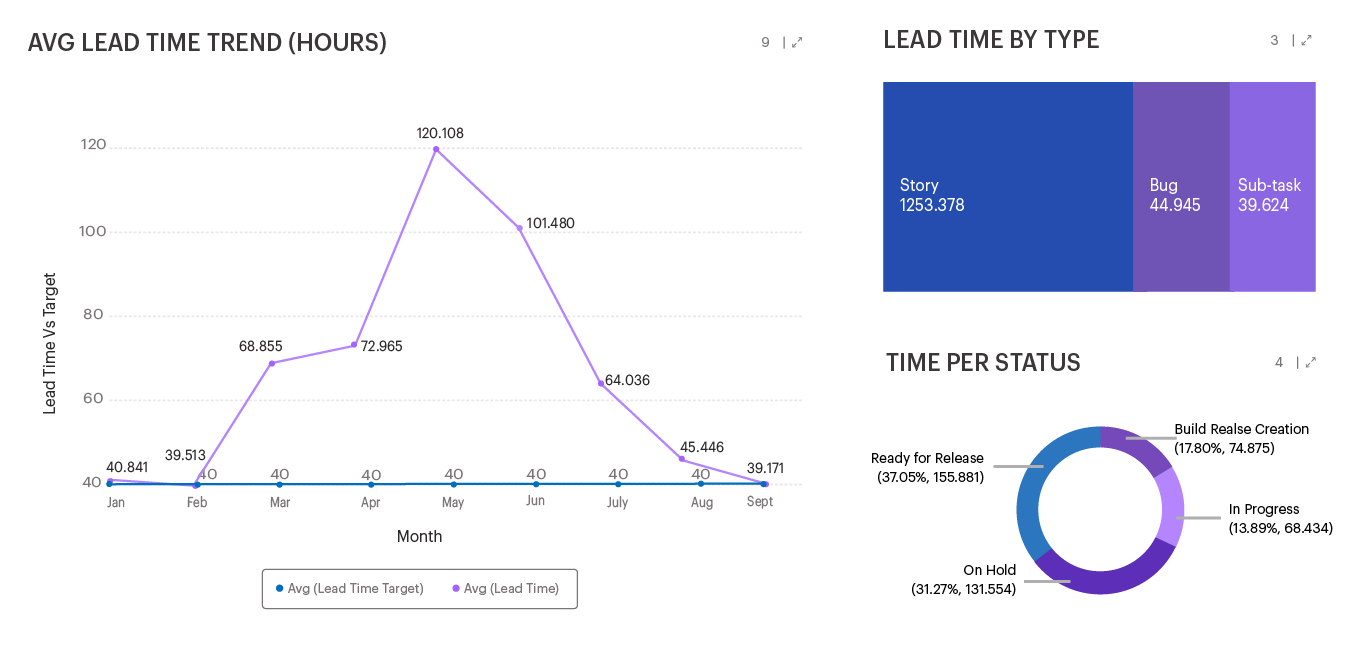
  • Visual Dashboard

    Use pre-built apps and templates to set up your DORA dashboard and visualize DORA metrics.

  • Industry Standard Metrics

    Track the four key DORA metrics - Deployment Frequency, Lead Time for Changes, Change Failure Rate, and Time to Restore Service.

SetUpDORAMetricsDashboardwithGathr
  • Custom Metrics

    Define your own metrics, beyond DORA, to track DevOps progress and make informed decisions.

  • Traceability

    Seamlessly trace issues across the DevOps lifecycle to identify bottlenecks and troubleshoot issues.

  • Proactive Response

    Enable faster feedback loops to continuously improve user experience.

EnsureContinuousDevOpsMonitoring

Integrations

Expert Opinion

Recognized by industry experts year after year

MEET GATHR

One-of-a-kind no-code, unified
data-to-outcome platform

  • No-code for data at scale, batch and streaming
  • Gen AI help to search, understand, query, and build easily
  • 250+ connectors,
    200+ operators,
    50+ apps and
    solution blueprints
  • Unified collaborative experience
  • Best of open source and enterprise grade
  • Production ready output from day 1

Capabilities

Learning and Insights

Stay ahead of the curve

FAQS

Find Your Answers

How DORA metrics help in assessing DevOps success?
While most organizations have embraced DevOps developing the right culture, establishing communication channels, and implementing advanced tools, they are still unable to assess the success of their DevOps initiatives. DevOps and engineering leaders recognize DORA metrics as a standard framework for measuring DevOps success. DORA metrics help them measure software delivery throughput (speed) and reliability (quality) accurately. By analyzing the DORA KPIs, teams can easily gain insights into performance trends, detect issues across different stages of DevOps, and take remedial actions to deliver better software, faster. For instance, by tracking deployment frequency, organizations can observe if their teams have improved over a period, remained consistent, or experienced extreme deviations. Similarly, a higher change failure rate can indicate issues with change management, quality testing, and more. With a DORA metrics dashboard, organizations can easily visualize DORA metrics, detect process bottlenecks, perform root cause analysis, and take action for continuous improvements in DevOps.
How can we measure business value with DORA metrics?
DORA metrics are a marker of software delivery throughput (speed) and reliability (quality), which eventually correlate with the delivery of higher end-user satisfaction and business value. However, organizations can track business value over a period based on certain focused and custom KPIs. For instance, the metric 'Innovation' can be defined as a function of every feature enhancement delivered to customers, excluding bugs. Tracking this metric can help businesses determine how much they have actually worked towards improving their product or service against removing its existing, lingering flaws. Similarly, Mean Time to Recover (MTTR), which is one of the 4 key DORA metrics, can provide insights into customer satisfaction. Such metrics and their trends over a period can offer organizations data-driven predictability and can be used as a business driver.
What are some common challenges teams face with their DORA dashboards?
Teams tend to misunderstand the purpose of their metrics and start using them as their goals, which is an anti-pattern as cited by Goodhart's Law - "When a measure becomes a target, it ceases to be a good measure." The metrics are the outcome of a team's performance; however, teams tend to game the system and shift their focus to improving their scores instead of real-world performance. Another major challenge with metrics is related to benchmarking; teams often lack awareness of what's a good deployment frequency in their context. Many times, the DORA dashboards are rigid and offer no clues as to what the metrics mean. For example, the DORA dashboard might indicate that the team deployed 200 times in a month but would not offer any insights into past trends or assess the lead time from request to delivery. Such dashboards offer limited flexibility in assessing the flow of deliveries and business value.
In addition to DORA metrics, what other metrics should we choose for end-to-end DevOps monitoring?
Selection of the right metrics can be a complex task. While the DORA metrics offer insights into the end performance of your DevOps practices, they can go only so far. For instance, DORA metrics alone cannot help you identify the bottlenecks in CI or answer why the software isn't always in a releasable state. You might need to track additional metrics to understand how long the branches exist, or how frequently the changes are made to the trunk, how many things are in progress, and so on. Additionally, organizations can measure defect volume and escape rate, failed deployments, change volume, unplanned work, and SLA compliance to get a more holistic view of their DevOps. Gathr can help you create a custom DevOps monitoring tool to meet these requirements.
How to avoid being misled by DevOps KPIs?
The selection of the right metrics is the most crucial step in the implementation and analysis of KPIs. For example, improvement in metrics like ‘lines of code’ and ‘number of defects fixed’ may give a false sense of comfort as they don’t necessarily translate to improvements in quality, productivity, and reliability. At times, it is seen that teams tend to focus on improving their scores and may lose sight of the business goals. For example, measuring the ratio of committed vs. completed features can force teams to prioritize schedules over quality. That’s why organizations need to find metrics that link directly to customer satisfaction and not just delivery goals.