BLOG
Real-time analysis of weather impact on New York City taxi trips in minutes
In this post, we will see how easy it is read data from a streaming source, apply data transformations, enrich data with external data sources and create real-time alerts in minutes with Gathr.
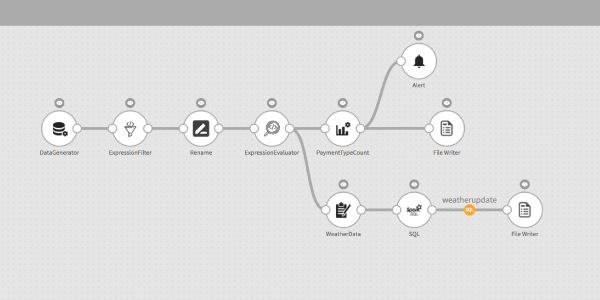
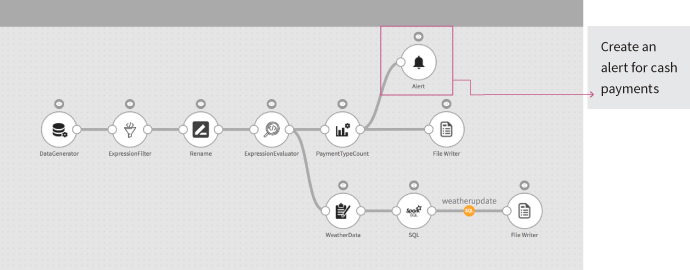
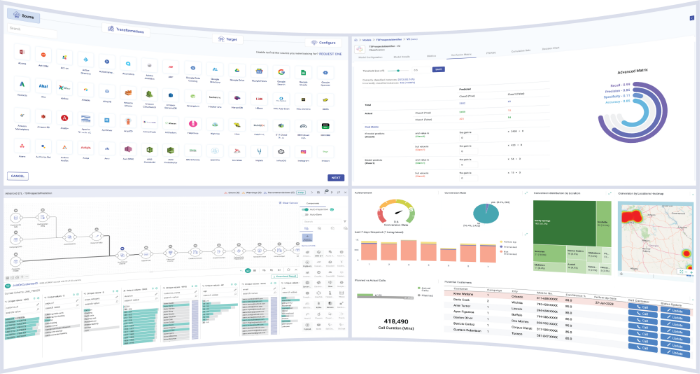
We will use the drag and drop interface and self-service features of Gathr to build a streaming pipeline (image 1) to analyze the impact of weather conditions on New York City taxi trips. This pipeline can be accessed and run on Gathr.
We will analyze two aspects; impact of weather conditions on the taxi trip (time taken to pick-up and drop-off the rider in co-relation to distance traveled), and the mode used to make payments (cash or card) to create alerts for cash payments beyond a set threshold.
Step 1: Read data from source
Read data from Data Generator, a streaming data source.
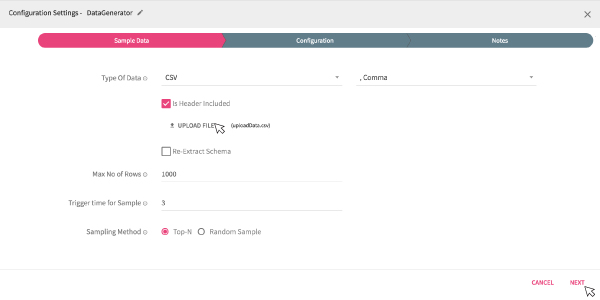
Once you drag and drop Data Generator onto the canvas, right-click the operator to configure it. The configuration window will appear (Image 2).
- Click Upload File to upload the data file containing the following data points for New York City taxi trips:
- Pick-up time and location
- Drop-off time and location
- Number of passengers in the cab
- Fare of the cab ride
- Trip distance
- Once the file is uploaded, click Next
Step 2: Identify data schema
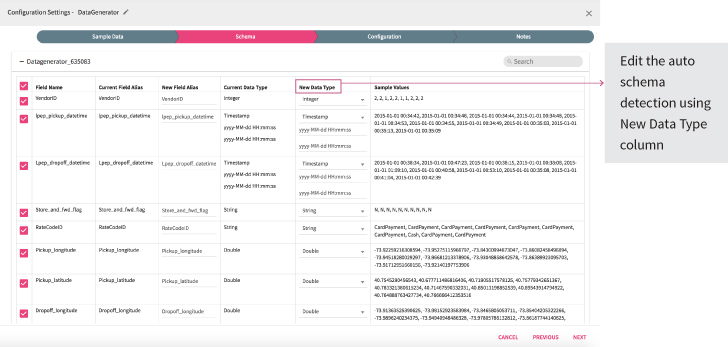
A schema identification window will appear (Image 3) driven from the auto-schema detect feature built-in Gathr platform.
Click Next to save this schema.
Schema derived from the auto-detection feature of Gathr can be edited to desired data type.
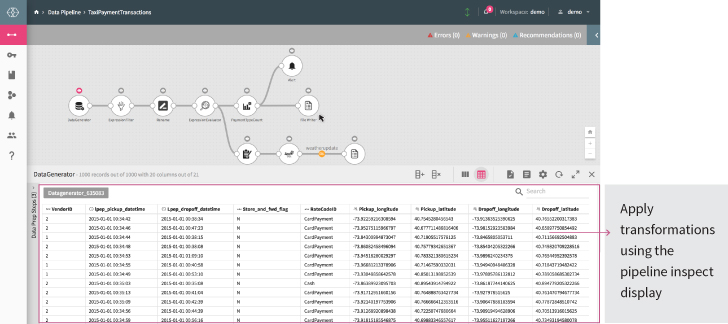
Step 3: Apply data transformations
As you save the data schema, the data inspect window will appear below the pipeline canvas (Image 4). Use Inspect Display window to apply pre-processing transformations to the data and alter it as required.
In this pipeline, three transformations have been applied:
- Filter
- Rename
- Date transformation
Step 4: Enrich taxi trips data with weather conditions data
After applying the transformations, follow these steps:
- Import weather conditions datainto the pipeline
- Join the data with rest of the pipeline using Spark SQL (Gathr allows you to write your SQL queries in-line in the operator to join data set).
- Persist the data using a File Writer.

- Right click on the ‘Spark SQL’ operator, a configuration window will appear (Image 6). Here you will see the ‘Weather Conditions Data’ is joined with the ‘Date’ of each taxi trip.
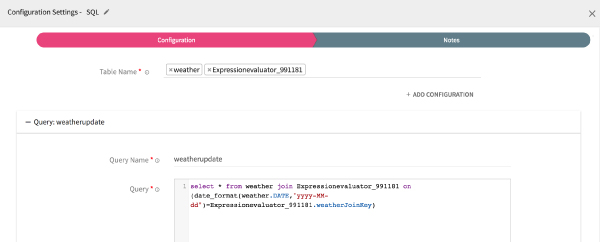
- Click Next.
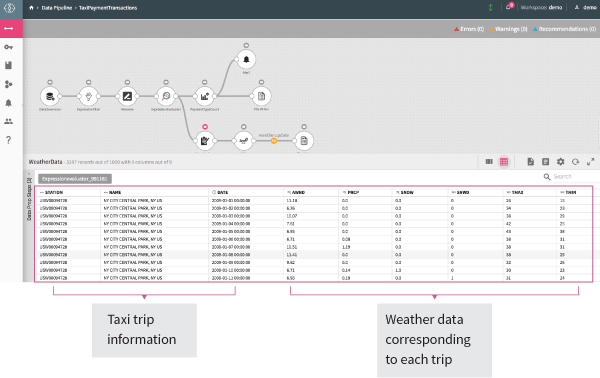
The inspect display window will appear (Image 7) displaying weather conditions data (like min and max temperature, precipitation, wind, snow and more) corresponding to each taxi trip.
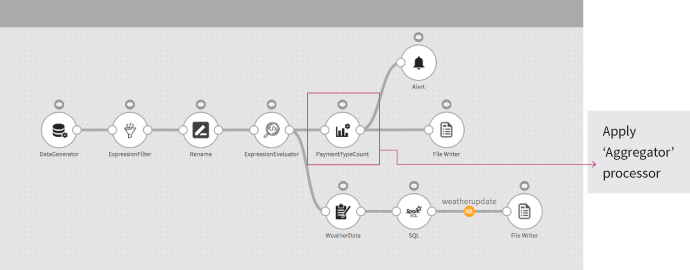
Step 5: Process cab fare data for payment method used
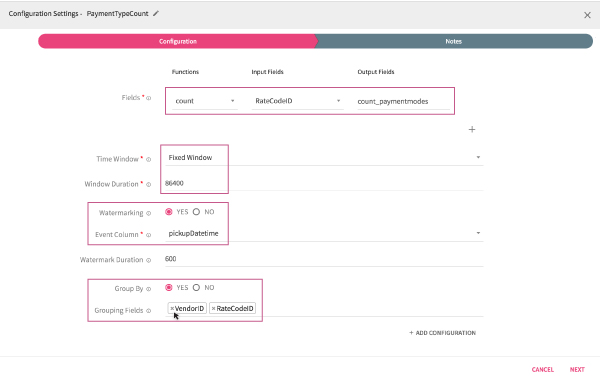
To count the number of total payments made by card and cash, apply aggregator processor ‘Payment Type by Count’.
Right-click Payment Type by Count.
The configuration window will appear (Image 9).
Configure the processor to:
- Count payments by different methods
- Fix a relevant time window for the aggregator processor
- Watermark the pick-up date and time
- Group results by ‘Vendor ID’ and ‘Rate Code ID’
Step 6: Create real-time alert
Drag-and-drop the Alert processor to create an alert for cash payments exceeding certain number.
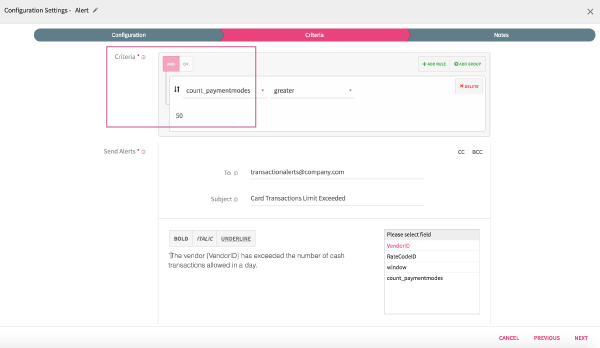
- Right-click Alert. The configuration window will appear (Image 11).
- Input the desired number in the Criteria, exceeding which an alert for cash payments should be created.
Step 7: Persist data
Use File Writer (Image 12) to persist the data.
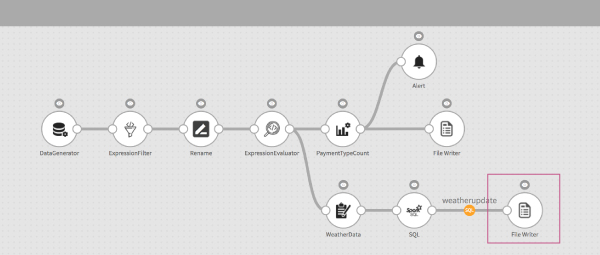
Right-click the File Writer operator to view the location where the file has been saved.
This concludes the pipeline. To build and run this pipeline on Gathr, start your free trial today.
Table of Contents
MEET GATHR

Turn raw data into business outcomes, at scale and 50x faster
-
Ingestion
-
ETL
-
CDC
-
DQM
-
ML
-
Insights
-
Atomation
-
Xops
-
Business Apps
Recent Posts
View more postsBlog

Blog

Blog

Blog