
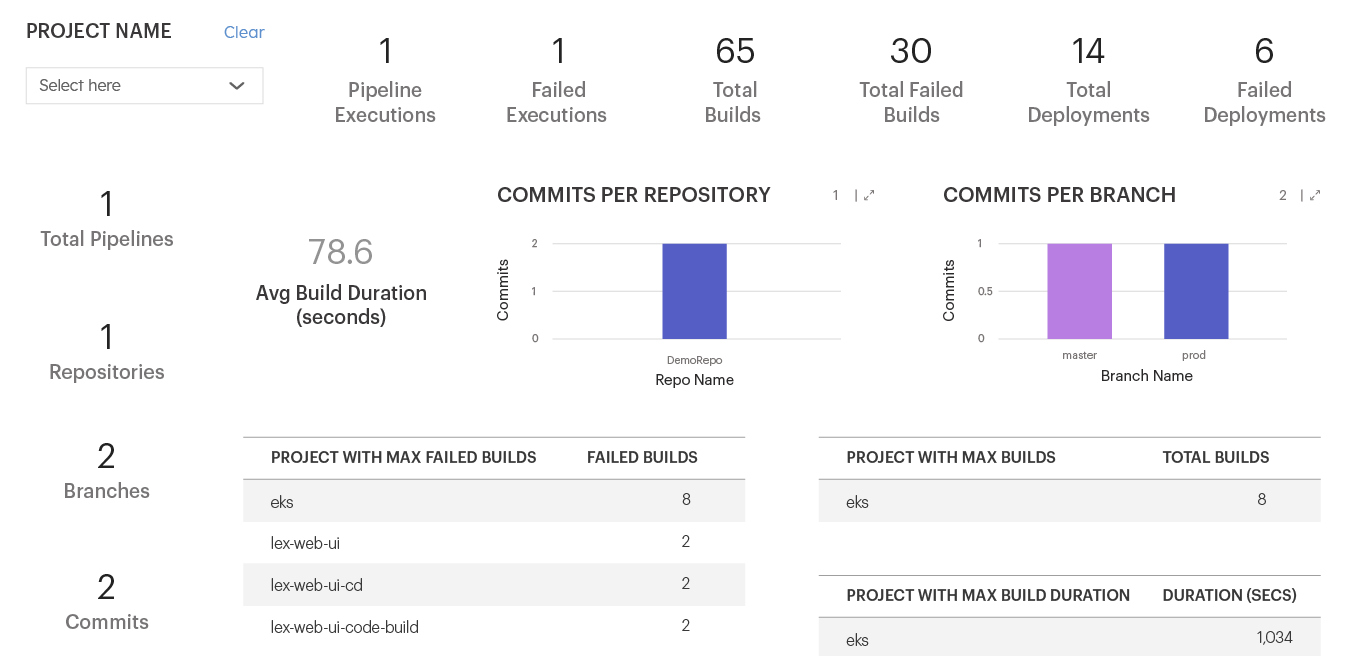
Get a quick summary of failed and successful builds, deployments, average build duration, and more. You can also identify projects with maximum failed builds and drill down to identify potential bottlenecks.
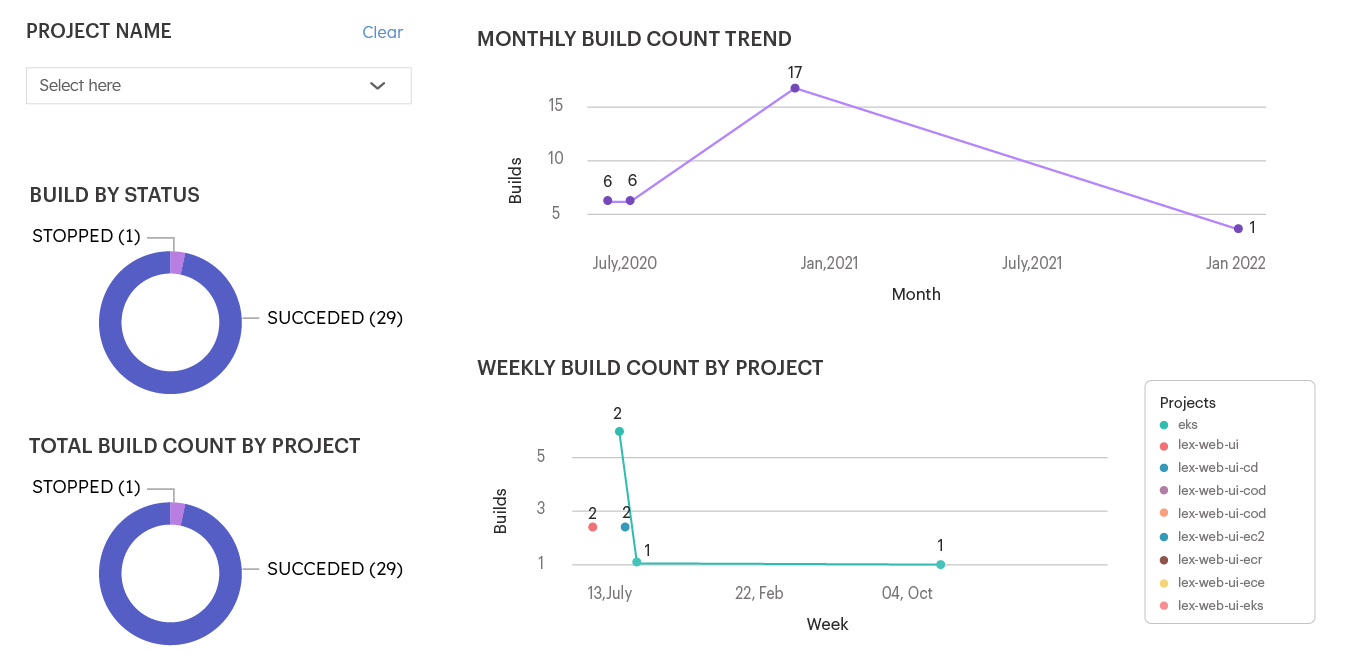
You can monitor project progress charts detailing the number of builds across projects, their status, weekly/monthly build trends, and more. The analysis can help you track your performance over a period.
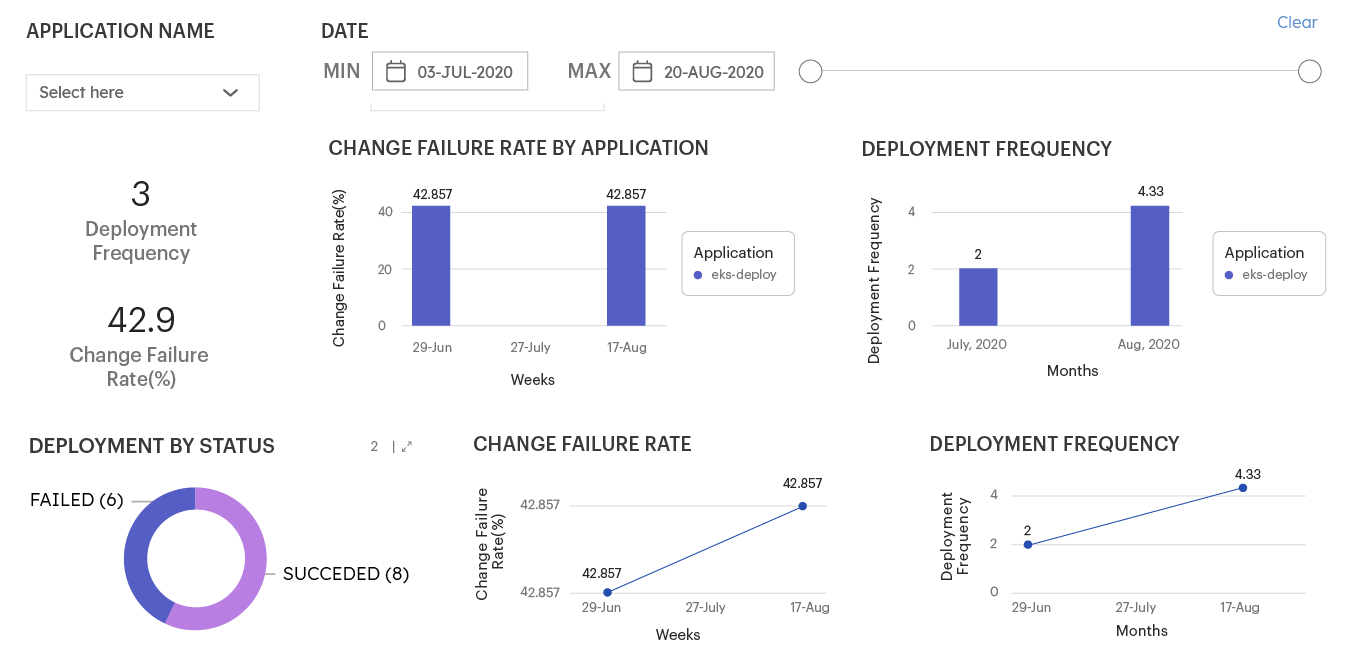
The dashboard helps you track critical DevOps metrics such as change failure rate and deployment frequency of your applications. You can also monitor the weekly and monthly trends of these metrics.


 Data integration
  Machine
  Action
  Workflow & business process automation
 Business