BLOG
Using Zeppelin to Build Data Science Models for Gathr
Data scientists use different applications like R, Python or Scala (with notebook tool like Apache Zeppelin) to develop data science models. For example, some prefer R to create their models, others like to write code for their models in languages like Python or Scala using notebook tools like Apache Zeppelin and so on.
Gathr, a real-time streaming analytics platform, allows users to build and deploy data models by using different tools like PMML, Scala, pyspark. This streaming analytics platform supports multiple languages and formats, enabling users to create the code in their preferred technology. Once the model is prepared, it can be deployed on Gathr to run and perform scoring over the data in a distributed fashion.
This article explains how users can create a data model in Apache Zeppelin notebook and use it with the Gathr platform. It also demonstrates how to use pyspark library to build a SVM classifier on Zeppeling and use it on the Gathr.
What is Apache Zeppelin?
Apache Zeppelin is a web-based notebook that enables interactive data analytics. Zeppelin supports many interpreters such as Scala, Python, Spark SQL, JDBC, Markdown and Shell. To get details on Apache Zeppelin setup, its installation and configuration, visit – https://zeppelin.apache.org/docs/0.6.0/install/install.html
DataSet
We will use IRIS dataset available at https://archive.ics.uci.edu/ml/datasets/Iris. This dataset contains 3 species of iris – Setosa, Versicolor and Virginica, with 50 instances of each. In this example, we will take first 100 rows from the dataset and build a SVM (SupportVectorMachine) binary classifier, which will predict the species Setosa or Versicolor, based on the given features.
Feature Information
- Sepal Length in cm
- Sepal Width in cm
- Petal Length in cm
- Petal Width in cm
Target/Label:
- Species (Setosa | Versicolor)
SVM classifier model using Zeppelin
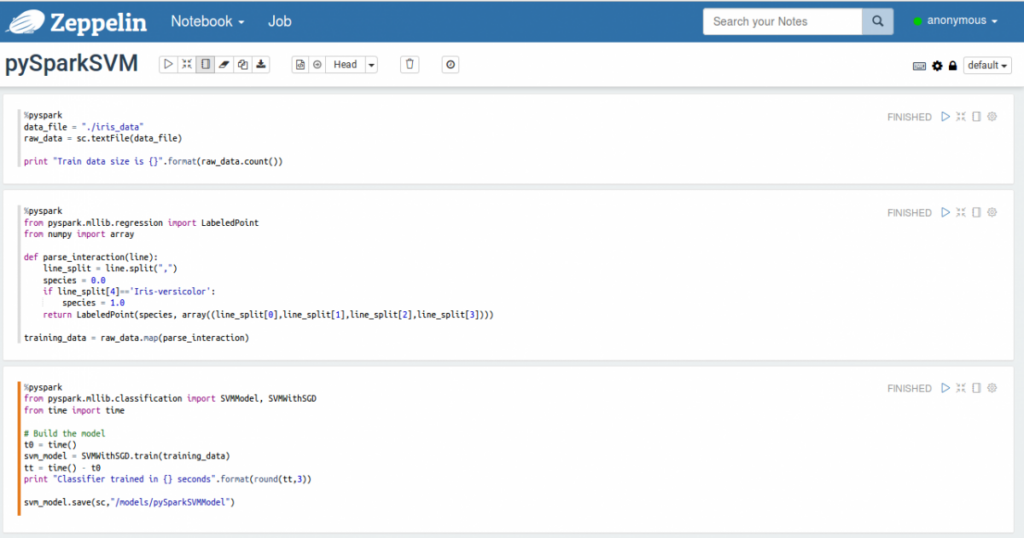
Below is an example of creating SVM model using pyspark library
Full Source Code: <To be provided as a downloadable link in a file>
|
# Getting the data and creating the RDD data_file = “./iris_data” raw_data = sc.textFile(data_file) print “Train data size is {}”.format(raw_data.count()) # Preparing the training data from pyspark.mllib.regression import LabeledPoint from numpy import array def parse_interaction(line): line_split = line.split(“,”) species = 0.0 if line_split[4]==’Iris-versicolor’: species = 1.0 return LabeledPoint(species, array((line_split[0],line_split[1],line_split[2],line_split[3]))) training_data = raw_data.map(parse_interaction) # Training and saving the SVM classifier from pyspark.mllib.classification import SVMModel, SVMWithSGD from time import time # Build the model t0 = time() svm_model = SVMWithSGD.train(training_data) tt = time() – t0 print “Classifier trained in {} seconds”.format(round(tt,3)) svm_model.save(sc,”/models/pySparkSVMModel”) |
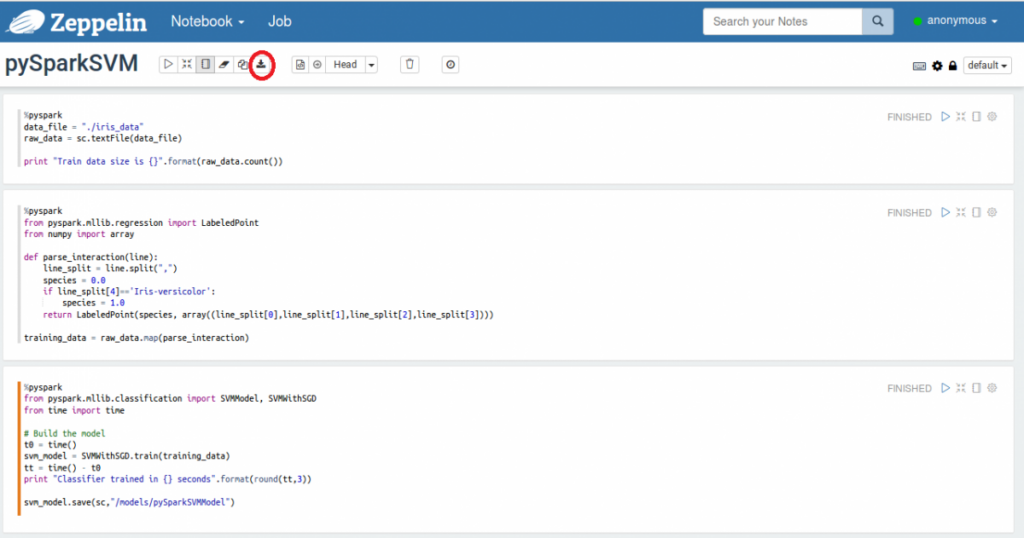
Below is the exported note for above model:
Using Spark Models with Gathr platform
In order to use external models in Gathr you will need to first register them.
In order to use external models in Gathr , users must first register them on this platform.
To register above created model, login to Gathr and follow below steps:
1) Go to Register Entities >> Register Models.
2) Click on link and mention the details on Register Model window
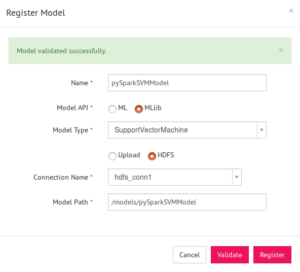
3) In the above case, the model is saved on HDFS, hence select HDFS option on Register Model window and mention the connection name and model location. (If model is present on local machine, then compress the model into .zip format and upload the zip file)
4) Click on Validate. Once model is validated successfully, click on Register
Using Spark models in a Gathr real-time pipeline for data analysis
Once the model is registered with Gathr platform, you can use it in your data pipeline to perform analytical operations on streaming data. We will see below how to use our registered SVM model in Gathr.
1) Create a message group, and a message say “flower_details” with five decimal fields sepal_length, sepal_width, petal_length, petal_width, predicted_species.
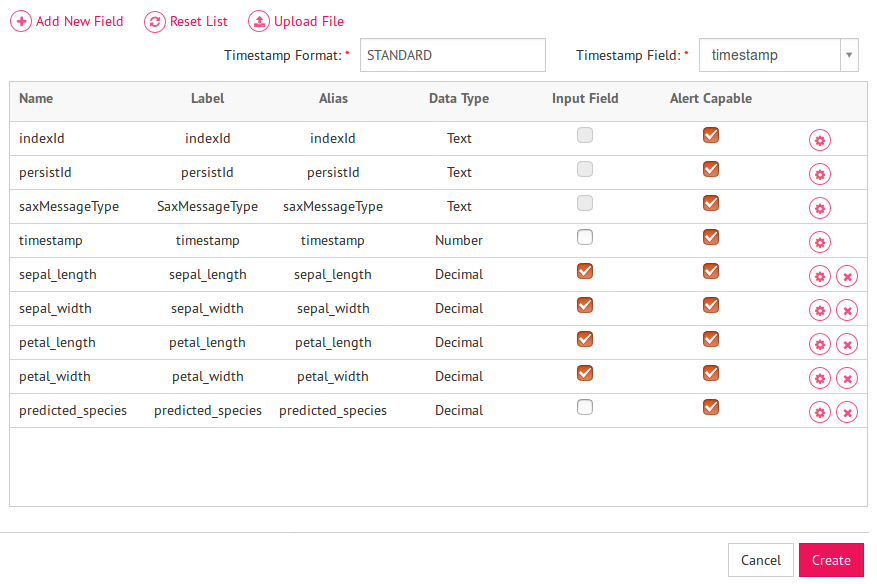
Here, first four fields are input fields and last field i.e. – predicted_species is output field which will hold the predicted species.
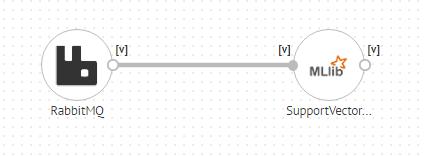
3) Create a new Data Pipeline from the left panel and click on Plus icon.
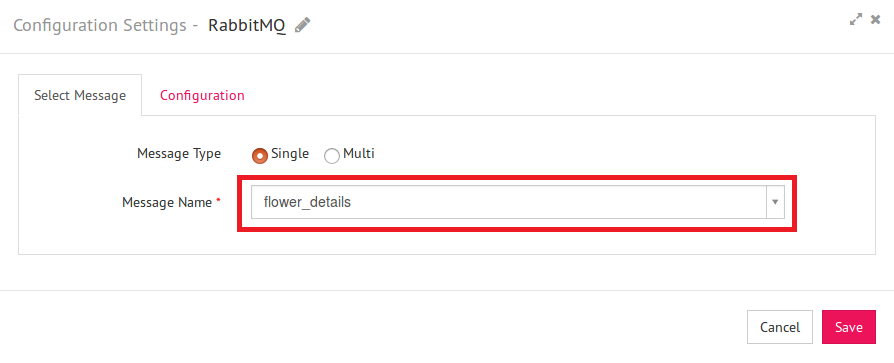
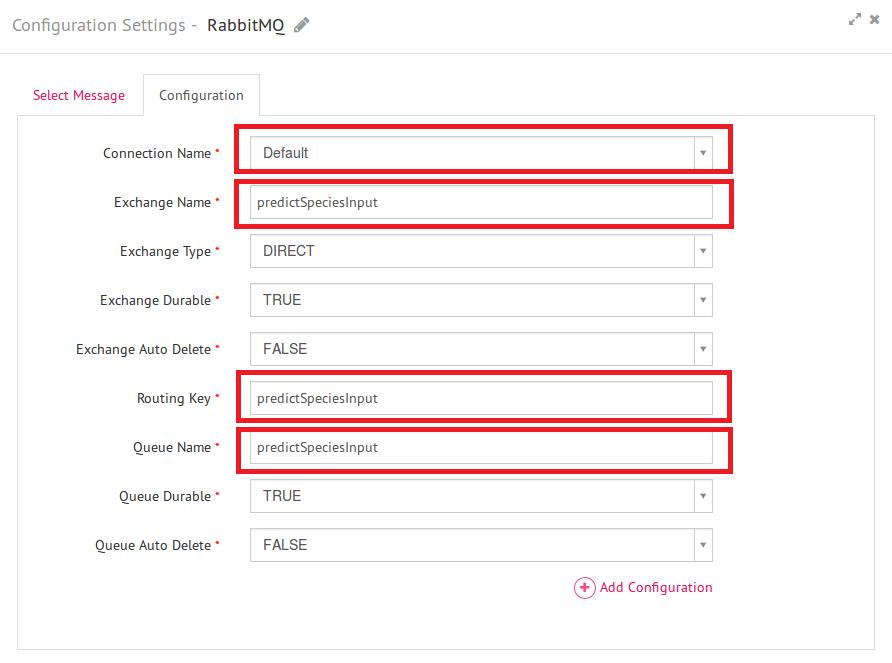
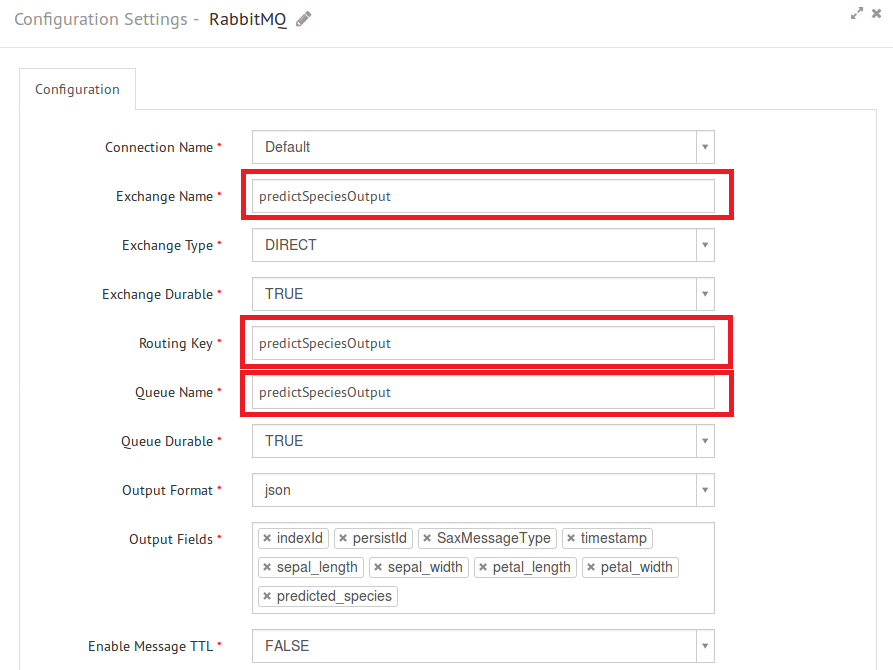
4) From the right panel, drag a channel from the list of available channels to the canvas where you are expecting your data from. Here, in this example we have taken RabbitMQ channel as our source of data. Right click on the channel to select the message name and configure properties such as connection name, exchange name, routing key and Queue name.
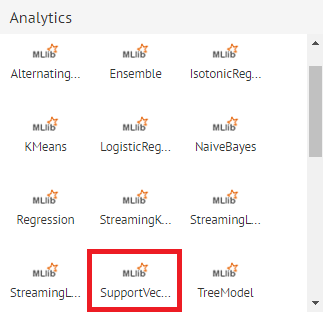
5) On the right panel, click on Analytics. It will display the list of analytical processors under three categories – MLLIB, ML and PMML.
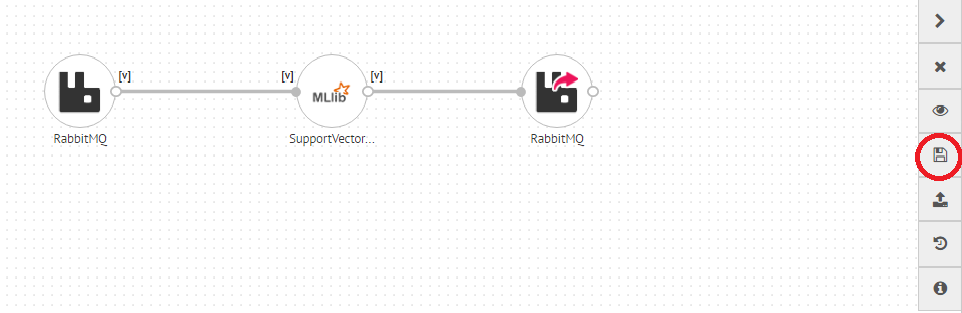
6) As the above SVM model belongs to spark MLlib package, drag SupportVectorMachine from MLlib section to the canvas.
7) Connect it with the RabbitMQ Source.
8) Right click and configure the SVM Model processor.
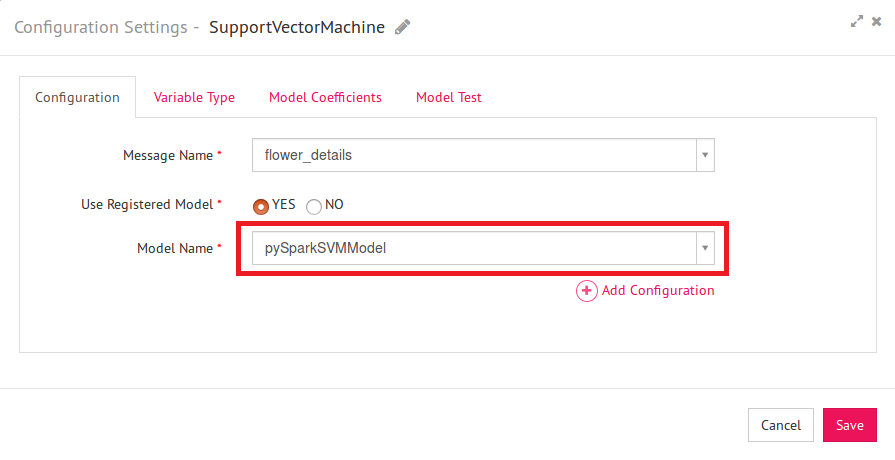
| Field | Description |
| Message Name | Name of the message to be used in the pipeline e.g. in this case select ‘flower_details’ |
| Use Registered Model | Allows to use a registered model or create a new model. Select ‘Yes’ |
| Model Name | Name of the model to be used in the data pipeline. Select registered model name i.e. pySparkLogRegModel |
9) Click on the Variable Type tab.
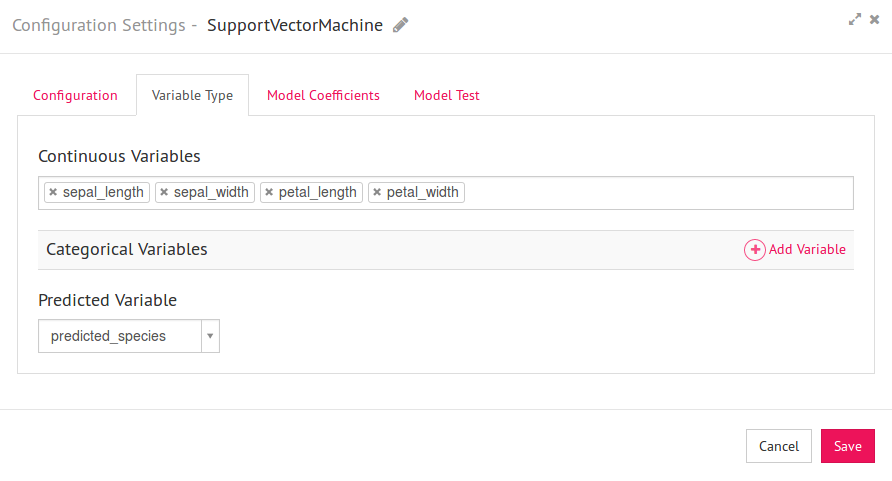
Since all four input message fields are of the Decimal type, they all will be available as Continuous variables. Select all the fields under Continuous Variables and select ‘species’ as Predicted Variable.
10) Now go to Model Coefficients tab and click on Load Defined Variables
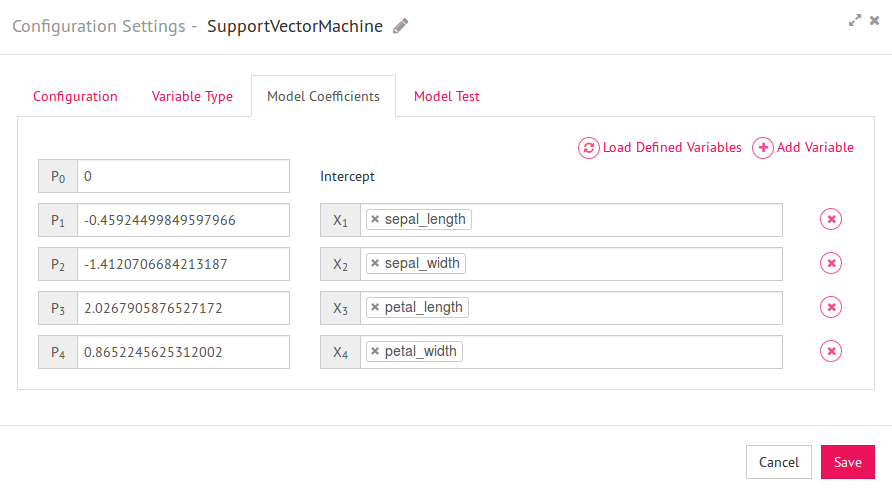
LoadDefined Variables will load the coefficient for the selected model. You can also edit the weights if you want and click on save.
11) Your model configuration is done now. You can also test the model to validate the output. Click on Model Test tab.
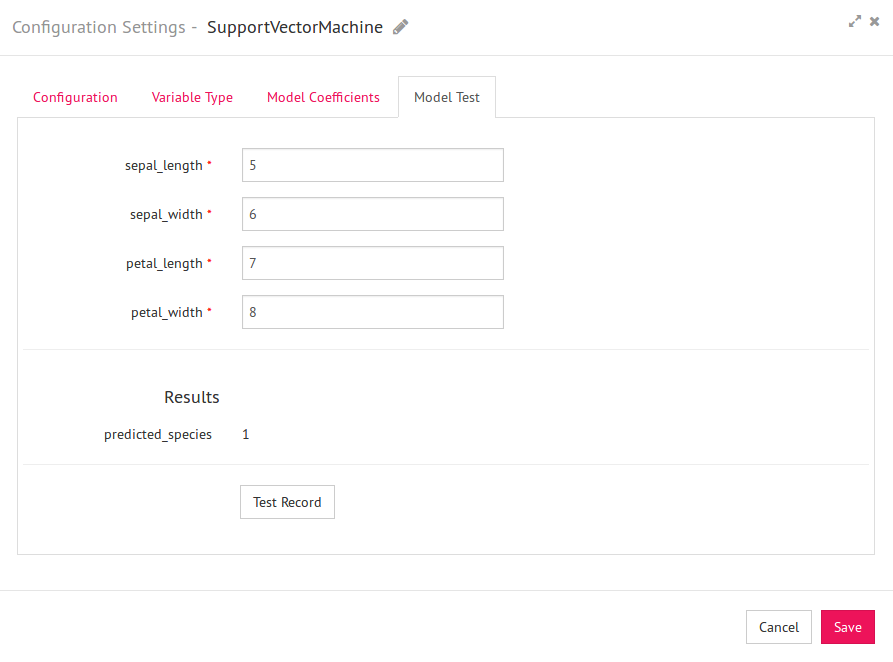
Mention the values against respective input fields and click on “Test Record”. Predicted species index will be displayed on the screen (which is 0 for setosa and 1 for versicolor)
12) Now, select your emitter from the Emitters section in the right panel and configure the same.
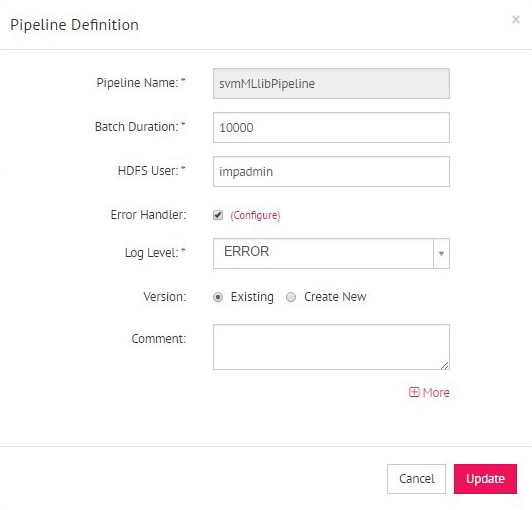
13) Your data pipeline is ready. Save the pipeline.
14) Just play your pipeline and push the test records into the selected channel. You will get the output from the emitter.
Gathr provides an extensive support for different types of model creation tools and allow users to perform analytics over streaming as well as batch data. The above post focuses on creating spark model on Apache Zeppelin and use it on Gathr platform, but models created in scala, PMML, H2O etc. are also supported by Gathr.
To learn more about Gathr, start your free 14-day trial today.
Table of Contents
MEET GATHR

Turn raw data into business outcomes, at scale and 50x faster
-
Ingestion
-
ETL
-
CDC
-
DQM
-
ML
-
Insights
-
Atomation
-
Xops
-
Business Apps
Recent Posts
View more postsBlog

Blog

Blog

Blog