Customers
Trusted by the largest enterprises on the planet
WHITEPAPER
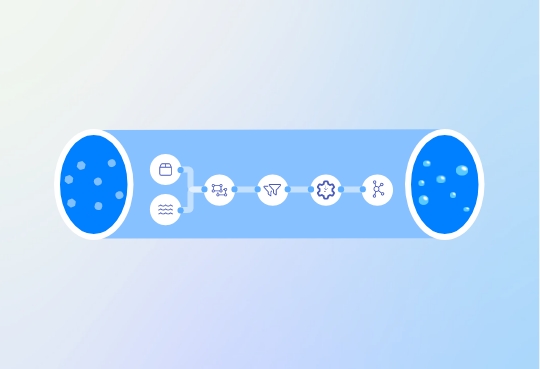
IoT the trigger for Streaming Analytics
Streamline data management and achieve better analytical results
Download Now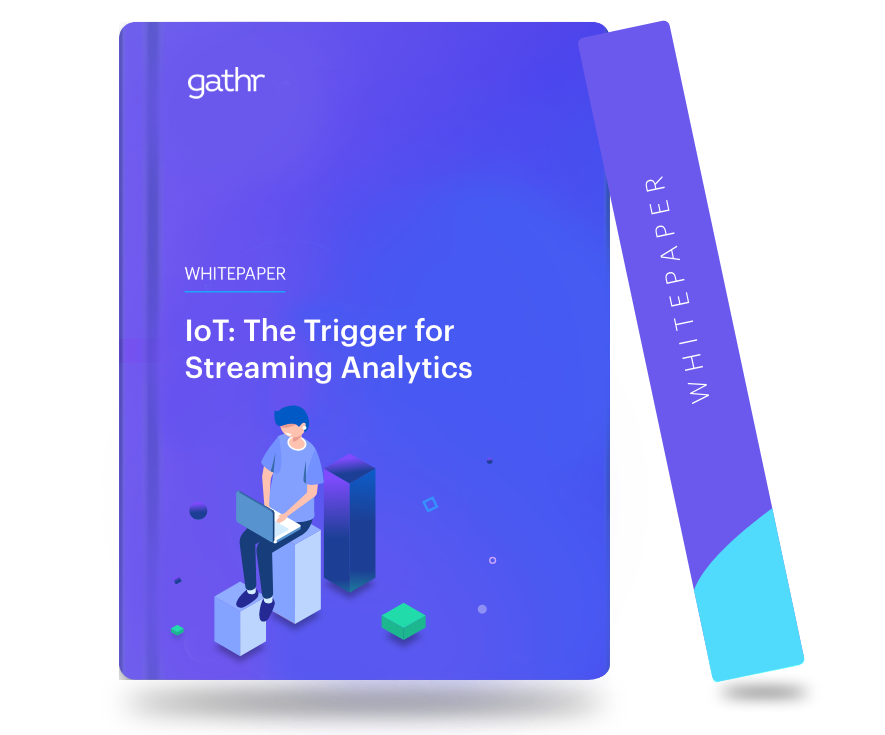
Benefits
Upgrade to 10x faster
processing powered by Spark
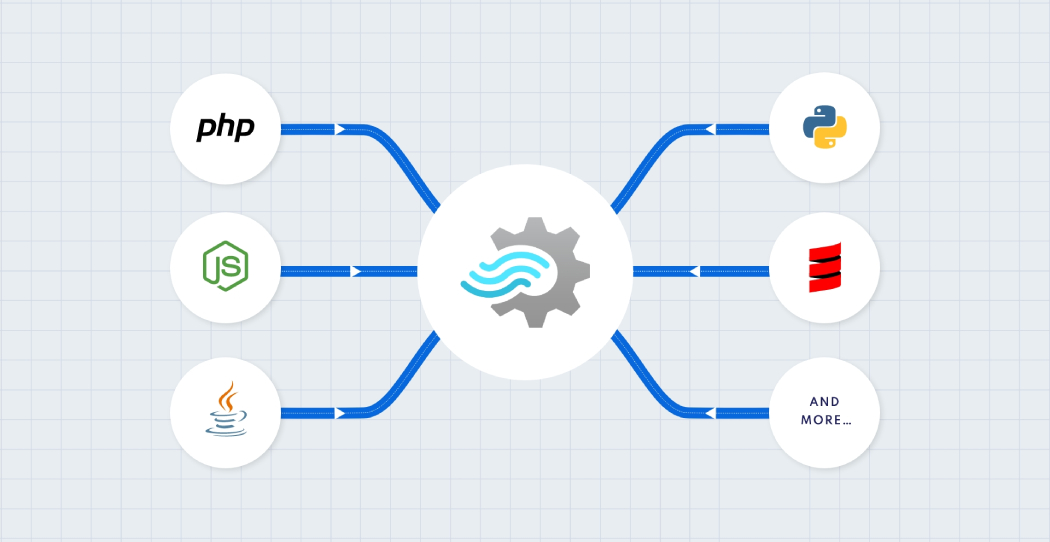
Now process more than 1 million events per second – both on-premises and in the cloud. Get native connectors for all types of data sources and formats to cut time and effort in development.

ML-powered
Analytics
Up your analytics game with support for ML, natural language processing, anomaly detection, geospatial analytics, predictive modelling, and more.
Simple Query
Designing
Use pre-built operators to join data from multiple connectors and design SQL join queries without manual coding. Or write custom SQL queries for complex use cases.
Easy
Auto-Scaling
Easily configure auto-scaling for all your pipelines. Optimize resource utilization based on conditions like memory, load, container availability, etc.
Advanced
Features
Replace out-of-order/missing data with Gathr’s built-in imputation functionality. Use advanced lookups and table processers to enrich incoming streams.
Webinar
Apache Spark: The New Enterprise Backbone for ETL, Batch and Real-time Streaming
Watch Webinar
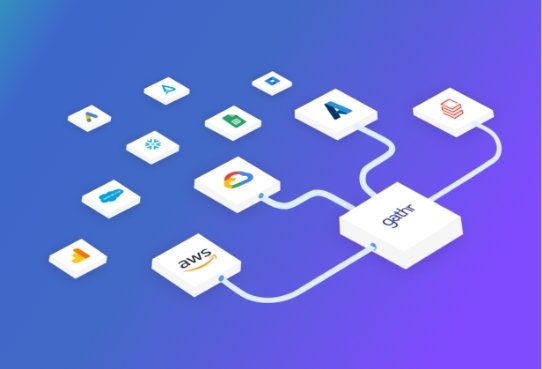
MEET GATHR
One-of-a-kind no-code, unified
data-to-outcome platform
- No-code for data at scale, batch and streaming
- Gen AI help to search, understand, query, and build easily
- 250+ connectors,
200+ operators,
50+ apps and
solution blueprints - Unified collaborative experience
- Best of open source and enterprise grade
- Production ready output from day 1
Capabilities
 Data integration
  Machine
  Action
  Workflow & business process automation
 Business
 Customers Speak
Trusted by business leaders

![]()
We can now identify bottlenecks in our Agile Scrum Development Cycle in just 30 minutes per week as compared to 8 hours per week earlier.
Software Engineering Director
Financial Services Company
Software Engineering Director
Financial Services Company
![]()
We can now identify bottlenecks in our Agile Scrum Development Cycle in just 30 minutes per week as compared to 8 hours per week earlier.
![]()
![]()
Gathr helped us power “in-the-moment” actionable insights from massive volumes of complex operational and digital interaction data.
Sarang Bapat
Director, Data Engineering Solutions and Delivery
![]()
Sarang Bapat
Director, Data Engineering Solutions and Delivery
![]()
Gathr helped us power “in-the-moment” actionable insights from massive volumes of complex operational and digital interaction data.

![]()
Gathr is one of the most advanced data integeration and transformation tools – it has helped us scan incoming data from ~10K application in real-time to identify anomalies for any abnormal user behavior.
Director of Analytics
Multinational Bank
Director of Analytics
Multinational Bank
![]()
Gathr is one of the most advanced data integeration and transformation tools – it has helped us scan incoming data from ~10K application in real-time to identify anomalies for any abnormal user behavior.
EXPERT OPINION
Recognized by industry experts year after year
![]()
Gathr is a unified data platform that offers capabilities for ingestion, integration/ETL, streaming analytics, and machine learning. It offers strengths in usability, data connectors, tools, and extensibility.

![]()
The platform offers event stream processing capabilities.

![]()
Best big data analytics product or technology for real-time analytics.

![]()
Enterprises that need a unified data platform leveraging popular open source, big data technologies, accessible to business as well as technical users, must evaluate Gathr.

![]()
Gathr offers a wide range of solutions. It combines the strengths of open source with the reliability and support of an enterprise solution, in the cloud, and at scale, while also offering significant ease of use, integration, and SaaS capabilities among other things.

LEARNING AND INSIGHTS
Stay ahead of the curve